

Explore this content with AI:
Most accounts treat Instagram Story analytics like a receipt — something to glance at after the fact and then file away. The accounts that grow treat them like a feedback loop.
Instagram Story analytics tell you exactly which frames held attention, where viewers left, what made someone tap back to rewatch, and which content was worth sharing to a DM. That’s not vanity data. That’s your audience telling you, frame by frame, what they actually want from you.
The brands and creators who learn to read those signals and adjust quickly are the ones whose Stories keep getting pushed to the front of the queue. Here’s how to read them — and more importantly, what to do with what you find.
What Instagram Story Analytics Actually Are
Instagram Story analytics are the native performance data Meta makes available for every Story frame you post. They’re only visible to you — not your followers — and they cover how people found your content, how they interacted with it, and how long they stayed.
The distinction between private data and public social proof matters here. The numbers in your Insights tab — reach, impressions, exits, link taps — are yours alone.
What your audience sees is surface-level: how many people responded to a poll, how many used your “Add Yours” sticker. The deeper behavioral data stays private, which means most creators are flying blind relative to what’s actually available to them.
In 2026, the platform’s ranking logic has shifted meaningfully. Instagram now weighs what it calls “Signals of Value” — saves, shares, and DMs — more heavily than passive views or even replies. A Story that 500 people watch all the way through is good. A Story that 80 people forward to a friend is better. Understanding this hierarchy changes how you interpret your data and what you optimize for.
How to View Your Instagram Story Analytics
1. For live or recent Stories
Open the Story from your profile, then swipe up (or tap the activity icon). You’ll see a viewer list alongside basic interaction counts — taps, likes, and any sticker interactions.
2. For historical data
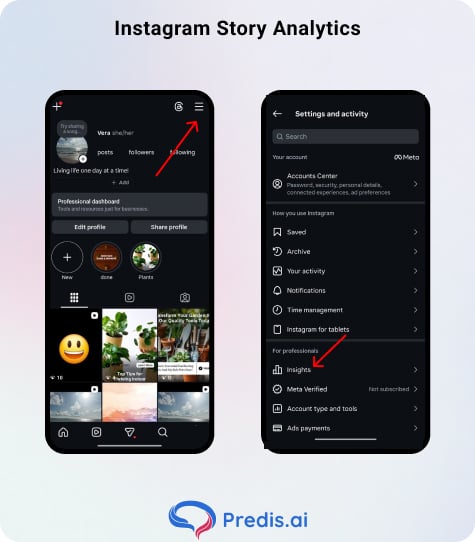
Go to your Professional Dashboard (tap the “Professional Dashboard” button on your profile, or navigate through Settings → Insights). From there, filter by Stories. Instagram retains Story analytics for up to two years, so you have a reasonable window to spot trends before the data expires.
3. For long-term trend mapping
Native Insights gives you the data but not the pattern recognition. Tools like Predis AI overlay your Story metrics with trend analysis — showing you which content types, posting times, and formats consistently outperform over weeks or months, not just individual posts.
If you’re posting Stories regularly, a third-party dashboard saves significant manual analysis time.
The Metrics That Actually Matter
Instagram’s Insights panel shows a lot of numbers. Most of them are secondary. These are the ones worth building your strategy around:
Discovery Metrics
Reach vs. Impressions
Reach counts unique viewers — each person counted once, regardless of how many times they saw your Story. Impressions count total views, including repeats. If your impressions are significantly higher than your reach on a given frame, people are rewatching it. Knowing the difference between reach vs impressions is essential here. That’s a strong positive signal worth noting.
New Follows
Instagram shows you which specific Stories led to new followers. This is underused data. If a particular frame or Story type is consistently converting viewers into followers, you’ve found a format that works at the top of your funnel — make more of it.
Interaction Metrics
Sticker Taps
This covers poll responses, quiz answers, and link sticker clicks. High poll participation means your question hit a nerve. It also means your CTA and destination were aligned.
Low sticker engagement on a Story with high reach usually means the interactive element was either too easy to ignore or placed poorly in the frame.
Shares and DMs
This is where the ranking shift matters most. When someone shares your Story to their DMs — forwarding it to a friend or a group chat — that’s private, high-intent engagement.
Instagram calls this “dark social” behavior, and it’s now one of the strongest signals the algorithm uses to judge content quality. A Story with 10 DM shares will outperform one with 200 passive views in terms of how the algorithm treats future content from your account. Watch this number closely.
Retention Metrics
Completion Rate
The percentage of viewers who watched your Story sequence from the first frame to the last. Calculate it by dividing the reach of your final frame by the reach of your first. A completion rate above 70% is strong. Below 50% means you’re losing people somewhere in the middle — and the exit taps data tells you exactly where.
Drop-Off Rate
Every frame shows an “Exits” count — the number of people who left the app or swiped to the next account at that point. When you see a spike in exits on a specific frame, that’s the weak link.
Common culprits could be:
- A frame that’s too text-heavy
- Visual that doesn’t follow logically from the one before it
- A Story that goes one or two frames longer than it needs to.
Back Taps
This can also be referred to as the “rewatch factor.” When a viewer taps back to see a frame again, they find something worth a second look — a piece of information they wanted to catch, a visual that surprised them, or content that moved too fast to absorb on one pass.
Frames with high back-tap counts deserve to be studied. What made someone want to see it twice? That’s your repeatable format.
KPIs by Business Goal
Tracking everything is the same as tracking nothing. Match your metrics to what you’re actually trying to achieve:
| Business Goal | KPI |
|---|---|
| Brand awareness | Reach Rate |
| Audience engagement | Interaction Rate |
| Traffic / conversion | Link CTR |
| Audience loyalty | Retention Rate |
| Content quality | DM Share Rate |
Pick the one or two that match your current priority and track them consistently over four to six weeks before concluding. Single-Story data is noisy; trends across 20 or 30 Stories are meaningful. Using a pie chart creator can help visualize how different Story metrics contribute to your overall performance, making trends and engagement patterns easier to understand.

How to Optimize Based on What You Find
1. The 3-Second Rule for Opening Frames
Drop-off is highest at the first frame. If someone doesn’t find the opening compelling within three seconds, they tap forward to the next account.
Use your exit data to diagnose weak openers: a frame with exits spiking at the start usually means the hook didn’t land fast enough. Test a bolder opening visual, a direct question to the viewer, or a strong claim that creates a reason to keep watching.
2. Double Down on Back-Tap Wins
When a frame has unusually high back taps, reverse-engineer what made it work.
- Was it the pacing?
- A specific piece of information?
- A visual format — infographic, face-to-camera, text on a solid background?
Pattern recognition across multiple high-back-tap frames usually reveals a repeatable format. Build a version of that format into your regular rotation.
3. Post at the Right Time for Your Audience
Instagram Insights shows “Most Active Times” — the hours when your specific followers are most likely to be on the platform. Your first Story frame hitting at the peak of that window maximizes initial reach, which compounds into better overall performance as the sequence builds momentum.
Consistency in timing also conditions your audience to expect your content at a certain point in their day.
4. Use the Data to Shape Your Sequence
A well-performing Story sequence isn’t random. It has a structure: an opening frame that grabs attention, middle frames that deliver value or build tension, and a final frame with an interactive element — poll, question box, or link sticker — that gives the algorithm an engagement signal and gives your viewer a place to go next.
Retention data shows you exactly which part of that sequence is underperforming. Fix the weak frame, not the whole story.
Best Practices for Stories That Perform
1. Add subtitles
A majority of Instagram users watch Stories with sound off. If your content relies on audio — voiceover, talking head video, interview clips, a significant portion of your reach is seeing a moving mouth with no context.
Instagram’s Speech-to-Text sticker auto-generates captions you can style and position. It takes 30 seconds and meaningfully improves retention for audio-dependent content.
2. Mix your formats
A feed of face-to-camera videos gets predictable fast. Rotate between face-to-camera, static graphics with text, behind-the-scenes clips, and screen recordings or product demonstrations.
Variety keeps the visual experience unpredictable enough to hold attention — and different formats tend to perform differently across audience segments, which your analytics will show over time.
3. End with an interactive element
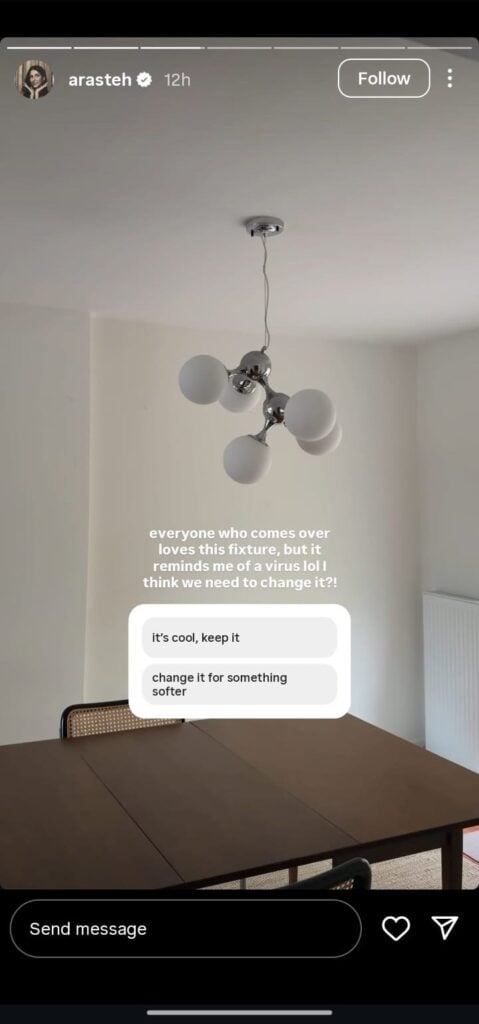
Closing a Story sequence with a poll, a question box, or a “This or That” sticker does two things: it gives viewers an easy way to engage, and it sends a strong interaction signal to the algorithm.
Even a low-stakes poll (“Which would you choose?”) generates replies that tell Instagram your content is worth showing to more people.
Stand Out on Instagram with AI Content 🌟
The Bottom Line
Your Story analytics aren’t a report card — they’re a conversation. Every exit tells you something. A back tap tells you something. Every DM share tells you something. The accounts that grow consistently aren’t posting more; they’re reading those signals more carefully and adjusting faster.
Pick one metric this week that you haven’t been tracking — completion rate, DM shares, back taps — and spend two weeks paying attention to what drives it up or down. One insight from your own data, applied consistently, is worth more than any best-practices list.
FAQs
Two common causes: content fatigue (you’ve been posting similar formats too frequently without variation), and you have been reposting content originally created elsewhere. These tend to see lower reach over time as the algorithm favors original content.
Check your drop-off data for which frames people are exiting on, and assess whether your recent Story formats have become repetitive.
The current sweet spot is 3–5 frames. Fewer than three, and your sequence doesn’t have enough room to build context or momentum. More than seven or eight, and the completion rate typically drops as the commitment to watch the full sequence feels heavier.
Less than they used to. The platform has shifted toward text-based SEO — the words you use in on-screen text and stickers now carry more discoverability weight than hashtag overlays. Use descriptive, searchable language in your Story text rather than stacking hashtags in a corner.