


Explore this content with AI:
Across more than 40,000 ecommerce brands, the median return on ad spend for Meta ads between August 2025 and July 2026 was 1.88, according to Triple Whale’s benchmark report. The typical brand got back $1.88 for every dollar of ad spend.
Is that good? It depends on one number most ad dashboards never show you.
A store that keeps 40 cents of every sales dollar after costs needs a ROAS of 2.5 just to break even. At 1.88, that store loses money on every order its ads bring in, even though sales are coming in faster than spend is going out.
This ROAS calculator closes that gap. Enter your ad numbers and your costs per order, and it returns your ROAS, the ROAS you need to break even, the ROAS you need to hit a profit goal, and what to do with the campaign.
How to use this ROAS calculator
 Predis.ai
ROAS calculator
Enter one campaign’s numbers and your costs per order. You’ll see your ROAS, the ROAS you need to break even, the ROAS that hits your profit goal, and what to do next.
This campaign is below break-even. You pay about $33.33 in ads per order but keep only $29.46, so each order loses about $3.87. Fix the ad, offer or page, or pause it.
- Your ROAS
- 1.80 180%
- Break-even ROAS
- 2.04 49.1% contribution margin
- Target ROAS
- 2.93 for 15% profit
- Break-even CPA
- $29.46 most you can pay per order
Counting product cost only would put break-even at 1.54. Shipping, fees and packaging move it to 2.04.
Runs in your browser. This page saves nothing you type.
The calculator needs five numbers, and you can pull all of them from your ad account and store admin:
- Ad spend: what you paid the platform for the period you’re checking.
- Revenue from ads: the sales your ad platform attributes to those ads.
- Average order value (AOV): revenue divided by the number of orders.
- Costs per order: product cost, shipping, payment fees and packaging. Anything that goes up when you sell one more.
- Profit to keep: optional, as a percentage of each sale. 15% is a reasonable starting point if you’re unsure.
You get four numbers back: ROAS, break-even ROAS, target ROAS and break-even CPA (the most you can pay to win one order). It also labels the campaign scale, hold or cut based on where your ROAS lands. Everything runs in your browser, and the page saves nothing you type.
The ROAS formula (and how to read the result)
ROAS = revenue from ads ÷ ad spend
Spend $1,000 on Instagram ads, get $4,000 in attributed sales, and your ROAS is 4.0. You’ll see that written a few ways: 4.0, 4x, 4:1 or 400%. They all mean $4 back for every $1 spent. Google Ads uses the percentage version, and its help page works through $5 in sales on $1 of spend as a 500% target ROAS.
The ROAS calculation is the easy part. Reading it correctly is where most store owners get burned.
ROAS compares two numbers only: what the ads brought in and what the ads cost. It knows nothing about what you paid your supplier, what shipping cost or the cut your payment processor took. A 4.0 ROAS on a thin-margin product can lose money. A 2.0 ROAS on a high-margin digital product can be very profitable.
ROAS vs ROI
ROI counts every cost in the business, from product to payroll to rent. ROAS counts only ad spend. Use ROAS to compare campaigns against each other this week, and ROI to judge whether the business as a whole is working. You need both, but only ROAS moves fast enough to steer a campaign.
What break-even ROAS means
Break-even ROAS is the point where your ads pay for themselves and nothing more. Below it, every sale the ads bring in costs you money. Above it, you’re profitable.
The formula is short:
Break-even ROAS = 1 ÷ margin
Amazon’s advertising math guide uses the same formula and the example most people start with: a 40% margin means a break-even ROAS of 2.5, so you need $2.50 in sales for every $1 of ads.
Here’s how fast the number moves:
| Margin | Break-even ROAS | Sales needed per $1 of ads |
|---|---|---|
| 20% | 5.00 | $5.00 |
| 30% | 3.33 | $3.33 |
| 40% | 2.50 | $2.50 |
| 50% | 2.00 | $2.00 |
| 60% | 1.67 | $1.67 |
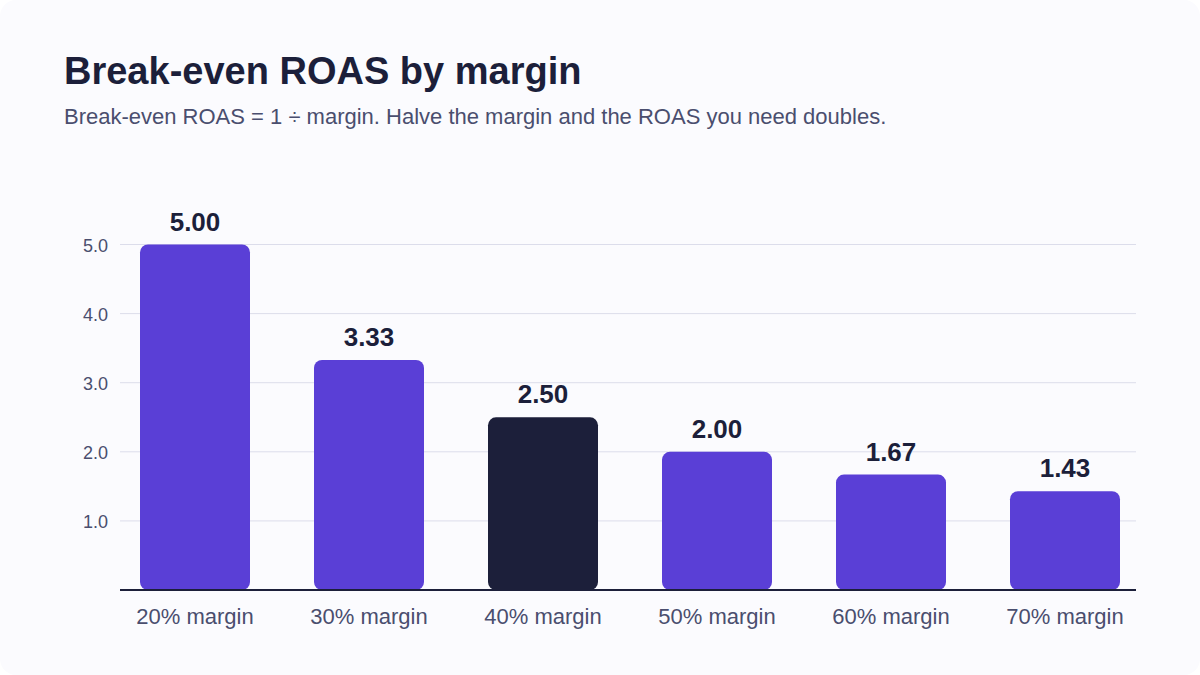
Halve your margin and your break-even ROAS doubles. It’s also why two stores can post the same 2.5 ROAS and be in completely different shape.
The catch is the word “margin.” Most guides plug in gross margin. For ad decisions you want contribution margin, and the gap between them is often big enough to flip a campaign from profit to loss.
How to calculate break-even ROAS in 4 steps
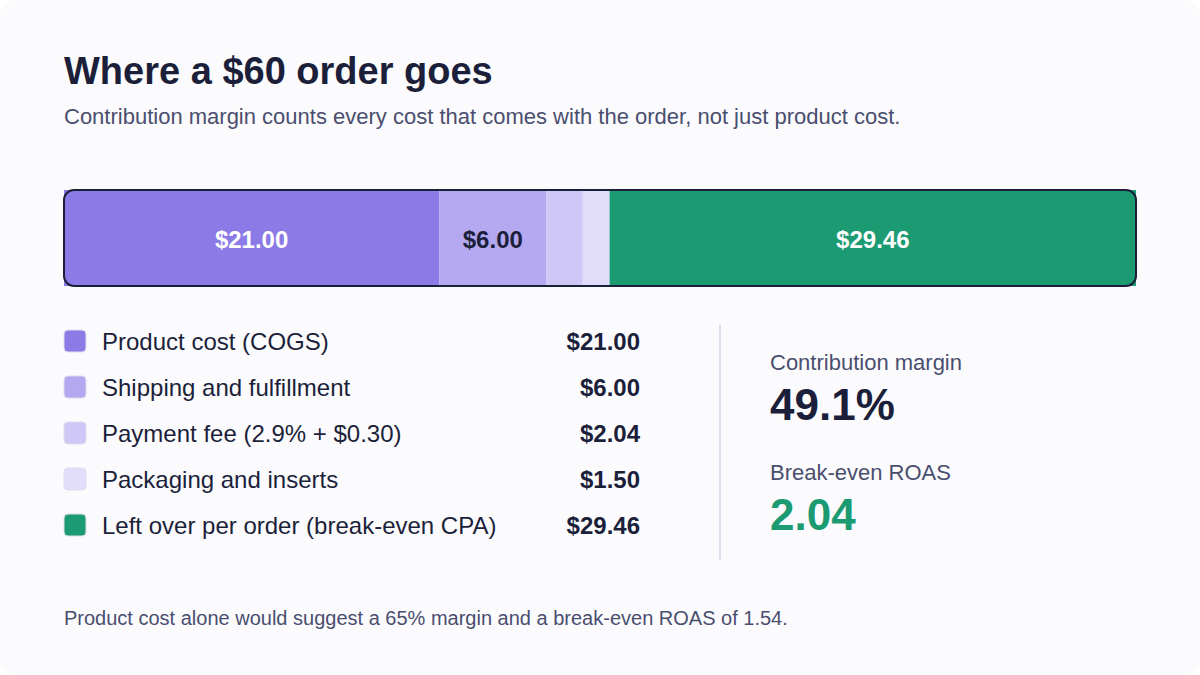
Contribution margin is what’s left from an order after every cost that comes with that order. Gross margin stops at product cost. Here’s the full version, with one example store running through each step.
Step 1: Find your average order value
Divide revenue by the number of orders for the same period. Use 30 to 90 days of data and strip out refunds. Our example store sells a $60 skincare set, and most orders contain one set, so AOV is $60.
Step 2: List every cost that rises with each order
Not rent. Not salaries. Only costs that show up because one more order happened:
- Product cost (COGS): $21
- Shipping and fulfillment: $6
- Payment processing: $2.04. Stripe’s standard US rate is 2.9% + 30¢ per card charge, so $60 × 2.9% + $0.30.
- Packaging and inserts: $1.50
Total: $30.54. If you have a steady return rate, add an allowance for that too. Leave ad spend out, since that’s what the formula is solving for.
Step 3: Work out contribution margin
Contribution margin = (AOV − variable costs) ÷ AOV
($60 − $30.54) ÷ $60 = $29.46 ÷ $60 = 49.1%
Step 4: Divide 1 by that margin
1 ÷ 0.491 = 2.04 break-even ROAS
The ROAS calculator at the top of this page runs these four steps for you once you enter your own costs.
Now compare that with the shortcut. Using gross margin alone, ($60 − $21) ÷ $60 = 65%, the break-even ROAS looks like 1.54. Run a campaign at 1.8 ROAS and the shortcut says you’re comfortably profitable. The full math says you’re losing about 12 cents on every ad dollar.
Your break-even CPA comes free
The $29.46 left over per order is also the most you can spend on ads to win one order and still break even. That’s your break-even CPA. If your ad platform reports a cost per purchase above it, the campaign is underwater no matter how its ROAS looks.
Make a UGC ad with Predis.ai
Make UGC-style video ads from one product link and let your numbers pick.
From break-even to target ROAS
Break-even is the floor. Nobody runs ads all year to stand still, so you need a second number: the ROAS that leaves the profit you actually want.
Target ROAS = 1 ÷ (contribution margin − profit you want to keep)
Say our skincare store wants to keep 15% of every ad-driven sale as profit. That’s 1 ÷ (0.491 − 0.15) = 1 ÷ 0.341 = 2.93. Campaigns at or above 2.93 hit the goal. Between 2.04 and 2.93, they make money but fall short of it.
If you bid with Google’s target ROAS strategy, two rules from Google’s help docs matter. Most campaign types need at least 15 conversions in the past 30 days before tROAS can do its job. And Google’s Shopping setup guide notes that lowering your target works like raising your bid: more volume at a lower return, while a higher target can cost you clicks.
Set the target from your margin math rather than a benchmark, and move it in small steps so the bidding has time to adjust.
What is a good ROAS? Your number, not a benchmark
A good ROAS is any ROAS above your target, held steady over a few weeks. That’s the honest answer, and it’s why benchmarks only go so far. You can’t see a competitor’s ROAS, but ad intelligence shows which of their ads they keep paying for.
Still, they give you context. In Triple Whale’s Meta data, median ROAS ranged from 1.13 for Media & Publishing to 2.35 for Sports & Outdoors. Both sit well below the “4:1 is good” rule repeated in a lot of strategy decks.
Two warnings before you compare yourself to anyone:
- Your margin decides what “good” means. A 2.0 ROAS is a loss at 40% margin and a profit at 60%.
- Attribution changes the number. Fospha’s benchmark analysis, reported by ClickZ, points out that the same campaign shows a different ROAS under last-click, modeled attribution and marketing mix modeling. Compare your ROAS with your own past numbers measured the same way.
If most of your spend is on Meta, this guide to a good ROAS for Facebook ads goes deeper on that platform.
Scale, hold or cut: a rule for every campaign
Once you know break-even and target ROAS, every campaign falls into one of three zones. The ROAS calculator above labels yours automatically.
| Zone | Campaign ROAS | What to do |
|---|---|---|
| Scale | At or above target | Raise budget in steps and check that ROAS holds as spend grows. |
| Hold | Between break-even and target | Keep it running, and fix the ad, offer or page before adding budget. |
| Cut | Below break-even | Pause or rebuild it. Every order it brings in costs you money. |
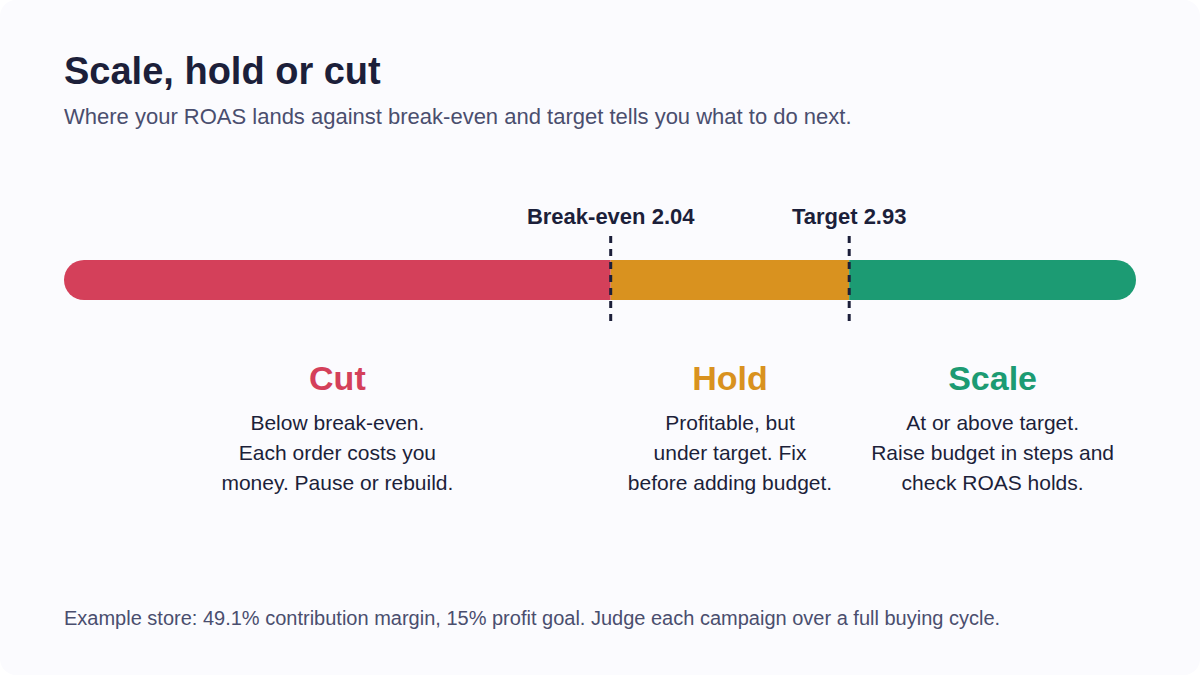
One caution: don’t sort campaigns on two days of data. Sales often land days after the click. Google asks advertisers to report values for 4 weeks or 3 conversion cycles, whichever is longer, before setting a ROAS target, and that’s a sensible bar for any channel.
Below break-even? What to fix first
A campaign under break-even usually has one of three problems, and the numbers tell you which:
- People scroll past it. A low click-through rate (CTR) means the ad isn’t earning attention. That’s a creative problem.
- People click, then leave. Healthy CTR with a weak conversion rate points past the ad to the landing page, price or offer. Triple Whale’s data shows this in Electronics, where CTR rose 21.52% year over year while conversion rate fell 15.69%.
- People buy, but the math is thin. Good CTR and conversion rate but still under break-even means margin is the issue. Raise AOV with bundles, cut a cost from Step 2 or revisit price.
The first problem is the most common and the cheapest to fix. Research from Nielsen and NCS, summarized by MarketingCharts, credits creative quality and messaging with 47% of the sales lift from advertising, rising to 56% for digital campaigns. With median Meta CPMs up 13.24% in Triple Whale’s latest data, an ad people ignore also costs more to run than it did a year ago.
Fixing a tired ad rarely means starting over. Keep what works and change one thing at a time: the hook, the first frame or the format. Predis.ai makes ad variants that look like your brand from one product link, and you can fix one frame instead of remaking the whole ad. If you’re unsure what to test next, competitor intelligence shows what’s working in your category before you spend on it.
Make ads that are yours
Run the numbers, then make the call
Your break-even ROAS isn’t a number you find once. It moves every time a supplier raises prices, a carrier changes rates or you add a free-shipping threshold, so rerun the ROAS calculator whenever a Step 2 cost changes, and at least once a quarter.
The bigger shift is how you read the dashboard. A ROAS on its own is just a ratio. Next to your break-even and target, it becomes a decision about where the next dollar goes and which campaign gets switched off. Run your numbers above, sort your campaigns into the three zones, and start with the cut pile.
FAQs
ROAS equals revenue from ads divided by ad spend. If $500 in ads brings in $1,750 in sales, your ROAS is 3.5, which you may also see written as 3.5x, 3.5:1 or 350%. The formula ignores product and shipping costs, so check it against your break-even ROAS before calling a campaign profitable.
It depends on your margin. At 50% contribution margin, 2.0 is exactly break-even. At 60% it’s profitable, and at 40% you lose money because break-even sits at 2.5. Work out your own break-even ROAS first, then judge any ROAS against it rather than an industry average.
Break-even ROAS is the point where ads pay for themselves with zero profit left over. Target ROAS is higher: it’s the return that leaves the profit you want to keep. Treat break-even as a floor a campaign shouldn’t stay under for long, and target as the number you bid toward.
Use contribution margin. Gross margin only subtracts product cost, so it leaves out shipping, payment fees and packaging, which makes your break-even ROAS look lower than it is. In the example above, gross margin suggested 1.54 while the full math gave 2.04.
Recalculate whenever a cost per order changes: new supplier pricing, a shipping rate update, a new payment provider or a change to your free-shipping threshold. If nothing changes, a quarterly check with a ROAS calculator keeps the number honest. Recheck before big sale periods too, since discounts shrink your margin and raise your break-even ROAS.
You may also like: