

Explore this content with AI:
Every post you publish without a test hypothesis is a guess dressed up as a strategy.
That’s not a criticism — it’s where everyone starts. The problem is that gut-feel content decisions don’t compound. What you learn from one post doesn’t automatically make the next one better. A/B testing is the mechanism that turns single posts into accumulated knowledge. And you don’t need a data science degree or a significant ad budget to start.
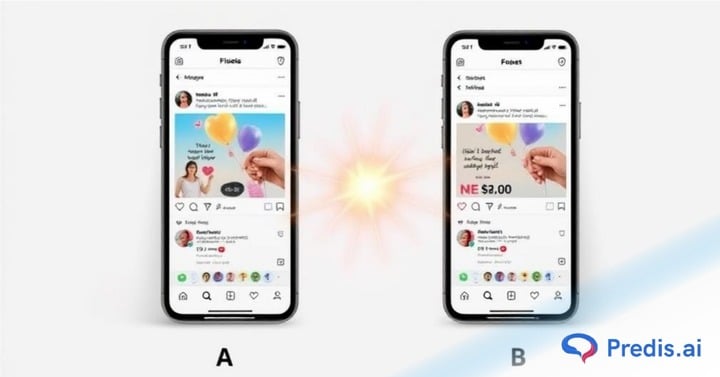
Here’s a 6-step framework for running your first social media A/B test — and building a system that keeps improving your content over time.
Before You Start: Organic vs. Paid A/B Testing
The important distinction beginners miss: organic and paid A/B testing operate under different rules, different timelines, and different confidence thresholds.
Paid A/B testing
Paid Ads (Meta Ads, LinkedIn Campaign Manager, TikTok Ads Manager) have built-in tools that split traffic between variants, control for audience, and report results in a structured format. The feedback loop is faster because ad delivery is controlled.
Organic A/B testing
Organic testing is messier — you post two versions at different times and compare performance across a similar window.
- There’s no algorithmic traffic split.
- External variables (day of week, trending topics, algorithm changes) can contaminate results.
- Sample sizes are smaller.
This doesn’t make organic testing worthless — it makes it different. The principles are the same; the confidence thresholds are lower, and the interpretation requires more caution.
The 6-Step A/B Testing Framework
| Step | Action | Output |
|---|---|---|
| 1 | Write a testable hypothesis | A clear question your test will answer |
| 2 | Choose what to test | One variable, high-impact |
| 3 | Design the test correctly | Reliable setup that produces trustworthy results |
| 4 | Run the test by platform | Executed variants with controlled timing |
| 5 | Read the results | A winner — or a decision to retest |
| 6 | Apply and compound | Updated playbook + next hypothesis |
1. Start With a Single, Testable Hypothesis
Every A/B test should answer one specific question. Not “what performs better?” but “does [specific change] produce [specific outcome] compared to [control]?”
The hypothesis formula: “If we [change X], then [metric Y] will [increase/decrease] because [reason].”
For example: “If we open the caption with a bold claim instead of a question, then our save rate will increase because bold claims create a stronger reason to revisit the content.”
That’s a testable hypothesis. It specifies:
- The variable (opening line format)
- The metric (save rate)
- The direction (increase)
- The reason (revisit motivation)
You know exactly what you’re testing, what you’re measuring, and what you expect to find.
Compare that to a vague assumption: “Our captions could be better.” That can’t be tested because there’s nothing specific to change and nothing specific to measure.
Common Mistakes
The rule that beginners break most often: testing more than one variable at a time. If you change the opening line AND the visual AND the hashtags simultaneously, you won’t know which change drove the result. One variable per test. Always.
2. Choose What to Test First
Not all variables are equal. Beginners waste tests on low-impact variables (emoji placement, exact hashtag count) when higher-impact variables would produce more learnable results faster.
The high-impact testing hierarchy:
| Priority | Variable Category | Specific Variables |
|---|---|---|
| High | Hook / Opening | Caption first line, Reel first 3 seconds, hook frame visual |
| High | Format | Reel vs. carousel, single image vs. carousel |
| Medium | CTA | Phrasing, placement, directional vs. curiosity |
| Medium | Caption length | Short vs. long, with vs. without line breaks |
| Lower | Visual style | Color palette, product vs. lifestyle, text-heavy vs. visual |
| Lower | Posting time | Same content, different publication window |
Start at the top. Hook testing has the highest downstream impact because it determines whether anyone reads, watches, or engages further. A better hook improves every other metric simultaneously. Once you have a winning hook approach, move down to CTA testing, then format, then posting time.
For creative variable testing, Predis AI’s AI post generator lets you create two distinct post variants from the same content brief in minutes — so the barrier to producing test-ready variants is reduced from 45 minutes to under 5. That matters for teams who keep delaying tests because creating two versions of everything feels like double the work.

3. Set Up Your Test
A poorly structured test produces misleading data that leads to worse decisions than no test at all. Three setup principles beginners consistently skip:
1. The sample size problem
A test on 200 impressions doesn’t produce reliable conclusions. The smaller the sample, the higher the probability that random variation explains the result rather than your variable change.
For organic posts, wait until both variants have reached at least 500–1,000 impressions before comparing. For paid tests, most platforms require a minimum audience of 1,000 per variant for statistical reliability.
2. The time window rule
Read results after a comparable time window for both variants, not when one looks promising.
- For Instagram and TikTok: 48–72 hours after posting.
- LinkedIn: 5–7 days (content has a longer tail).
- Facebook organic: 5–7 days.
- For paid tests: follow the platform’s recommendation, which is typically 7–14 days for campaign-level tests.
Checking results at 6 hours and declaring a winner based on which post has more likes is one of the most common beginner errors — and one of the most misleading.
3. Controlling for external variables
Post both variants in the same week, ideally on the same day of the week if you’re testing two separate posts. Avoid testing during major holidays, platform algorithm updates, or days when news events in your industry might distort engagement. If something significant happens in your niche between posting Variant A and Variant B, your results are contaminated.
4. Run Your First Test by Platform
1. Instagram
For organic testing, post Variant A and Variant B 3–5 days apart on the same day of the week. Use Instagram Insights to compare reach, engagement rate, save rate, and (for Reels) completion rate across the same time window after posting.
For paid, use Meta Ads Manager’s A/B test feature — it splits your audience automatically and reports results with a confidence score.
2. LinkedIn
Post Variant A and Variant B on the same day of the week across two separate weeks. LinkedIn posts have a 5–7 day content window, so wait the full week before comparing.
Track impressions, engagement rate, and click-through for organic content. For paid LinkedIn campaigns, Campaign Manager has a built-in A/B test tool for ads.
3. Facebook
For organic page posts, use the same method as Instagram — same day, one week apart, same time of day. Facebook’s Page Insights shows reach, engagement, and link clicks.
For paid content, Ads Manager has the most robust A/B testing infrastructure of any platform — audience split, delivery optimization, and automatic winner declaration.
4. TikTok
Post Variant A and Variant B on the same day across two weeks. TikTok’s analytics show completion rate, average watch time, and shares — which are the metrics that matter for testing hook frames and video structure. TikTok’s algorithm distributes content to small test audiences first, so give each variant at least 48–72 hours before comparing.
For teams managing multiple platforms simultaneously, Predis AI’s scheduler lets you publish both test variants at optimized posting times without manual timing coordination — keeping the posting window controlled without the operational overhead of tracking it manually.
5. Read Your Results Without Jumping to the Wrong Conclusions
Define your success metric before the test starts
Not after you see the numbers. If your hypothesis was about save rate, judge the result by save rate — not by whichever metric happens to favor the variant you preferred. Pre-committing to the metric removes the temptation to cherry-pick the number that tells the story you want.
The metrics that matter by test type:
- Hook/opening line test: Completion rate (Reels), swipe-through rate (carousels), “more” tap rate (captions)
- CTA test: link taps, profile visits, DM initiations — depending on what the CTA was driving
- Format test: reach (Reels outperform static for Explore), save rate (carousels often outperform Reels for saves)
- Posting time test: engagement rate in the first two hours, reach within the first 24 hours
Learning to interpret campaign data and measure audience engagement is an important part of building effective social media strategies. Skillfloor offers practical social media marketing training covering campaign planning, performance analysis, content optimisation, and hands-on assignments to help learners develop industry-relevant skills.
Statistical significance in plain language:
When one variant outperforms the other by a small margin on a small sample, the difference might be random.
A general rule for organic social testing: if Variant A’s save rate is 3.2% and Variant B’s is 3.4% across 600 impressions each, the difference isn’t reliable enough to call a winner. If Variant A’s save rate is 1.8% and Variant B’s is 3.6% across the same sample, that’s a meaningful difference worth acting on.
Free tools like Neil Patel’s A/B Significance Test or VWO’s significance calculator let you input the two results and get a confidence percentage. Aim for 85–90%+ confidence before standardizing a winner into your approach.
When to extend the test
If both variants have performed similarly and neither has reached your sample size threshold, extend the window before calling it. If the results are directionally clear but confidence is below 80%, rerun with a larger audience before applying the learning broadly.
6. Apply What You Learned
A test result you don’t document is a test you’ll run again from scratch. Build a results log — even a simple spreadsheet — with columns for:
- Test date
- Platform
- Variable tested
- Hypothesis
- Variant A description
- Variant B description
- Success metric
- Result
- Winner and “applied to playbook” flag
Over six months of consistent testing (even at one test per week), that log becomes a proprietary knowledge base about what works for your specific brand, audience, and content category. No competitor has the same data. No industry benchmark replaces it.
Building a testing backlog
Never run out of hypotheses. Mine your comment sections for questions that reveal what your audience doesn’t understand about your product. Check your DMs for the phrases customers use to describe what they want. Look at competitor posts that outperformed their average — what did they do differently? Every observation is a potential hypothesis.
The compounding effect
Three tests a month produce 36 documented learnings a year. Each winning approach gets standardized into your content playbook, raising your baseline performance. The next test starts from a higher floor. Brands that test consistently don’t just have better posts — they have a continuously improving system.
What Most Beginner A/B Testing Guides Get Wrong
1. Testing too many variables at once
Changing the image, caption, and hashtags simultaneously gives you a result but no explanation. You don’t know which change drove it, so you can’t replicate it.
2. Declaring a winner after 48 hours
Early engagement on social media is noisy. A post that surges in the first day often plateaus; one that starts slowly can build over a week. Give your time window rule priority over impatience.
3. Measuring likes when the goal was link clicks
Metric-objective mismatch is the most common analytical error. Define your success metric in the hypothesis before the test, and measure only that metric when reading results.
4. Treating each test as a one-off
Testing once every few months produces isolated data points. Testing weekly produces patterns. Patterns are what drive strategy.
5. Running tests during peak campaign periods
A test run during a major sale, a brand PR moment, or a platform-wide trending topic is contaminated by external variables beyond your control. Test during normal operating conditions.
The Social Media Testing Stack: Building a Continuous System
The difference between a beginner who runs one test and a marketer who consistently outperforms their niche is operational: one has a system, one has an experiment.
The 3-layer testing system:
- Weekly micro-tests: Small variable changes — opening line, CTA phrasing, posting time. Fast to set up, fast to read. Runs continuously.
- Monthly theme tests: Broader format or creative direction tests — Reel vs. carousel, personal story vs. educational hook, short vs. long caption. Takes 3–4 weeks to produce reliable results.
- Quarterly format experiments: Testing new content structures, platforms, or content pillars. Longer time horizons, strategic rather than tactical impact.
The test backlog method:
Maintain a running list of hypotheses in a document. Every comment, every DM question, every competitor post that outperforms the average is a potential hypothesis entry. When you sit down to plan next week’s content, pull from the backlog. You never start from blank.
The monthly testing review:
A 30-minute team ritual. Pull up the results log.
- Which variables have produced consistent winners? – Standardize those into the content playbook.
- The tests produced inconclusive results – Rerun with a larger sample or a cleaner variable.
- Which hypotheses in the backlog should move to next month’s queue?
This is the review that turns raw test data into an evolving strategy.
The Bottom Line
Every consistent improvement in your social media performance traces back to a better decision made — and better decisions come from evidence, not instinct. A/B testing is how you generate that evidence systematically, at whatever budget and team size you have.
Start with one hypothesis this week. Run it cleanly — one variable, a defined metric, a proper time window. Document the result. Then build the backlog that makes sure you always have a next test ready.
The compounding effect of 36 tests a year isn’t just better posts. It’s a brand that knows its audience more precisely than any competitor who’s still guessing.
FAQs
Regular posting is publishing content and observing what happens. A/B testing is publishing two versions of content where one variable differs, then comparing performance to determine which version produces better results for a specific metric.
The difference is intentionality: A/B testing answers a specific question; regular posting doesn’t.
Both — but with different mechanics and confidence levels. Paid tests use platform tools to split audiences automatically, producing more statistically reliable results faster.
Organic tests require posting variants at different times and controlling for external variables manually. Organic testing is less precise but still produces meaningful directional learnings, especially over multiple test iterations.
The hook — the first line of your caption, the first three seconds of your Reel, or the first frame of your carousel.
The hook determines whether anyone engages further. A stronger hook improves every downstream metric simultaneously, making it the highest-leverage variable for beginners to test first.