
Explore this content with AI:
In the rapidly shifting landscape of social media, the definition of success has undergone a radical transformation. Gone are the days when a “million followers” was the undisputed gold standard of digital influence. As we navigate 2026, the industry has fully embraced a more nuanced, telling metric: Engagement Rate (ER).
In an era dominated by algorithmic feeds, AI-curated content, and a “post-follower” environment, your engagement rate is the true pulse of your online presence. It tells you not just how many people see your content, but how many people care about it.
Why Benchmarks Change Every Year
If you are using 2022 benchmarks to judge your 2026 performance, you are setting yourself up for frustration. Algorithms evolve; they prioritize different formats (like the shift from static images to short-form video, and now toward “community-centric” threads).
Furthermore, user behavior changes—audiences in 2026 are more likely to “save” or “share” content to private groups than they are to leave a public comment.
This guide provides a deep dive into the formulas you need, the 2026 benchmarks across platforms, and the strategies to ensure your content doesn’t just reach screens but sparks action.
What Is Engagement Rate?
At its simplest, engagement rate measures the level of interaction that social media content receives relative to the size of the audience. It is a percentage-based metric that levels the playing field.
Why Engagement Beats Follower Counts
Follower count is a “vanity metric.” It’s easy to inflate and often hides a “ghost” audience—users who followed years ago but no longer log in.
The 5K vs. 200K Example: Imagine a niche creator with 5,000 followers who consistently gets 500 likes and 50 comments per post (a 11% ER). Compare them to a legacy brand with 200,000 followers that only gets 200 likes (a 0.1% ER).
For an advertiser, the 5,000-follower account is infinitely more valuable because its audience is attentive and responsive.
Why Engagement Rate Matters in 2026
- Quality Control: It is the most honest feedback loop. High ER signals to you (and the platforms) that your content is high-quality and relevant.
- Influencer Marketing Viability: Brands no longer pay for reach; they pay for resonance. Agencies use Engagement rate to filter out creators with fake or disengaged followers.
- The Feedback Loop: Most 2026 algorithms use “initial engagement” as a gatekeeper. If your first 100 viewers engage, the algorithm pushes the content to 1,000 more. Low engagement kills reach before it starts.
- Audience Loyalty: In a saturated market, high engagement indicates that you have successfully built a community, not just a broadcast channel.
What Counts as Engagement in 2026?
Engagement is no longer just a “Like.” It is a spectrum of interactions:
- Active Interactions: Likes, comments, shares, and saves.
- Story Interactions: Poll responses, “Add Yours” sticker taps, and direct message (DM) replies.
- Video Metrics: Watch time, rewatches, and “Completion Rate” (finishing the video).
- Action-Oriented: Link clicks, profile visits, and “taps on product tags.”
Engagement Rate Formulas: Examples Included
There is no “one size fits all” formula. The one you choose depends on your specific goal.
1. Engagement Rate by Followers (ERF)
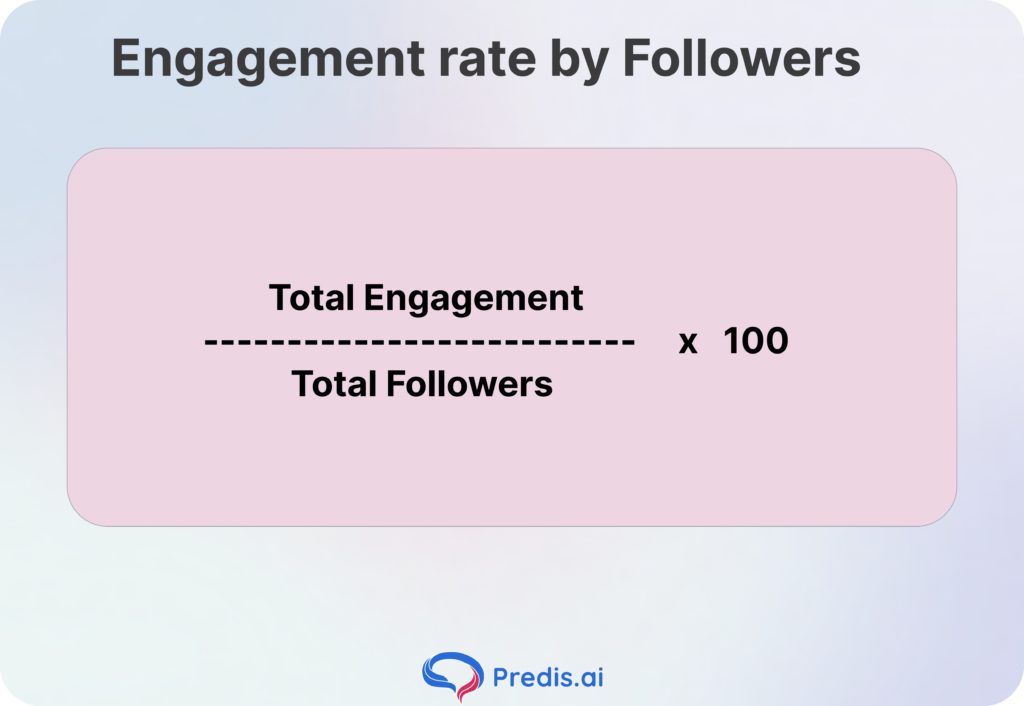
- Formula: Engagement Rate = (Total Engagement ÷ Total Followers) × 100
- Best for: Comparing yourself to competitors or evaluating influencers.
- Example: A page with 20,000 followers gets 1,200 engagements.
- (1,200 / 20,000)*100 = 6
2. Engagement Rate by Reach (ERR)
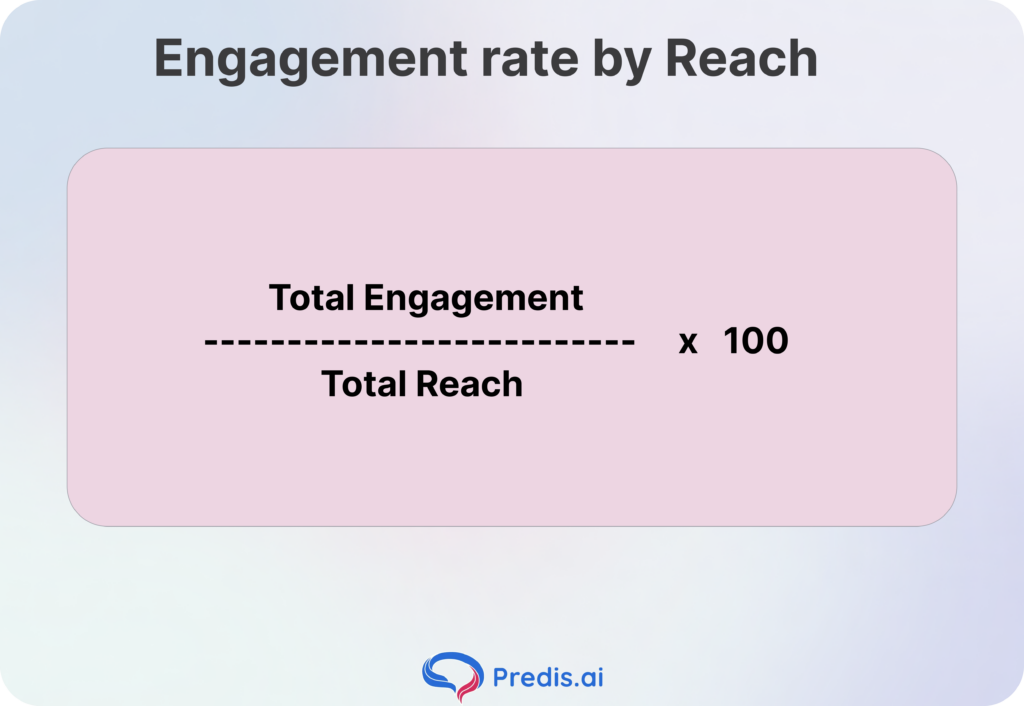
- Formula: Engagement Rate = (Total Engagement ÷ Total Reach) × 100
- Best for: Measuring content quality. This is the most accurate formula in 2026 because it only counts people who actually saw the post.
- Example: A post reaches 10,000 people and gets 800 engagements.
- (800 / 10,000)*100 = 8
3. Engagement Rate by Impressions (ERI)
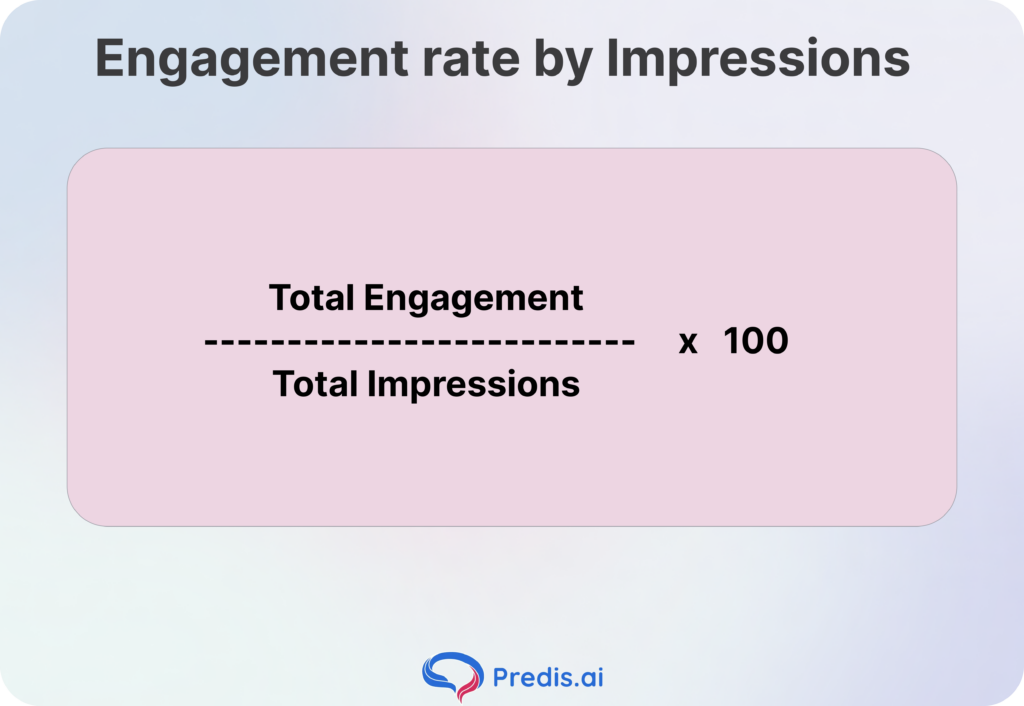
- Formula: (Total Engagements / Total Impressions) x 100
- Best for: Paid ads. Since one person can see an ad three times (3 impressions), this measures how effective the creative is at stopping the scroll repeatedly.
4. Engagement Rate by Views (ER Views)
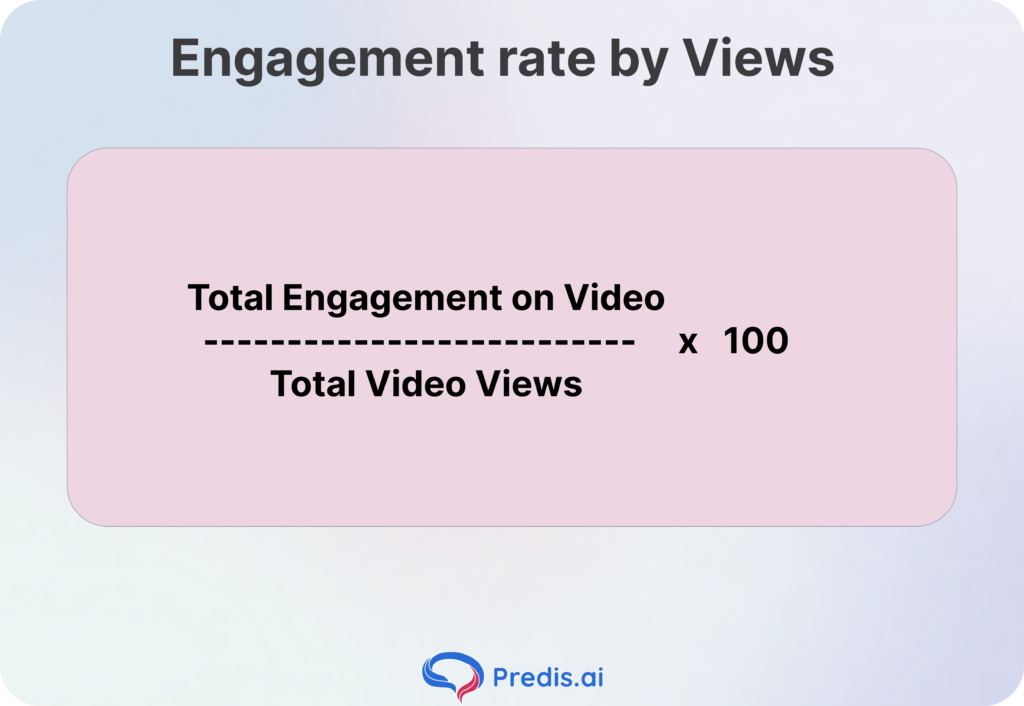
- Formula: (Total Engagements on Video Post / Total Video Views) x 100
- Best for: Short-form video platforms like TikTok, Reels, and YouTube Shorts. This measures how effectively your video converts a passive “viewer” into an active “participant” after the initial view is triggered.
5. Engagement Rate per Post (ER Post)

- Formula: (Total Engagement on a Specific Post / Total Followers) x 100
- Best for: Monthly reporting and long-term strategy tracking. This formula smooths out “viral outliers” to provide a realistic baseline of how your average piece of content performs with your established audience.
6. Daily Engagement Rate (Daily ER)
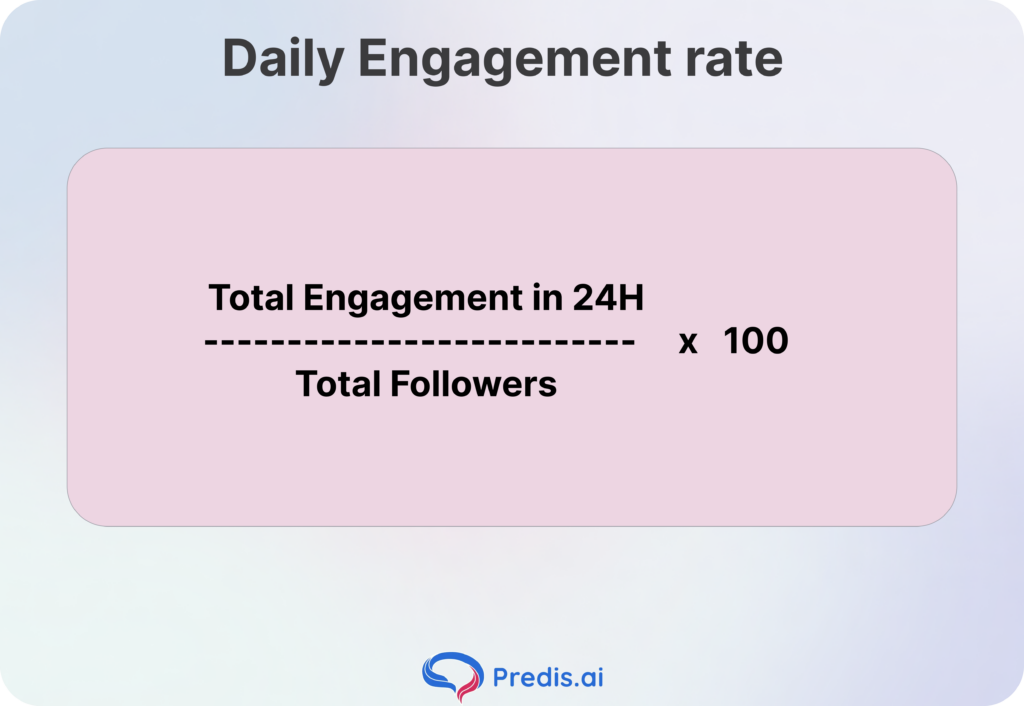
- Formula: (Total Engagement in 24h / Total Followers) x 100
- Best for: High-frequency accounts and community managers. It measures the total “daily buzz” or cumulative impact of your brand’s presence, accounting for followers who may interact with multiple posts throughout a single day.
Engagement Rate Benchmarks by Platform (2026)
Instagram has transitioned into a “Direct Message and Stories” platform. Here are some of the benchmarks for various account sizes:
| Audience Category | Follower Count | Emerging Benchmark (Low) | Top-Tier Benchmark (High) | Target Average |
| Nano-Influencer | 1K – 10K | 4.00% | 6.00% | 5.00% |
| Micro-Influencer | 10K – 50K | 2.00% | 4.00% | 3.00% |
| Mid-Tier Creator | 50K – 500K | 1.50% | 3.00% | 2.25% |
| Macro-Influencer | 500K – 1M | 1.00% | 2.00% | 1.50% |
| Mega-Influencer/Celeb | 1M+ | 0.50% | 1.50% | 1.00% |
TikTok
TikTok remains the king of high engagement due to the “For You” page’s aggressive interest-based targeting.
| Audience Category | Follower Count | Emerging Benchmark (Low) | Top-Tier Benchmark (High) | Target Average |
| Nano-Creator | 0 – 1K | 10.00% | 18.00% | 14.00% |
| Micro-Creator | 1K – 10K | 8.00% | 12.00% | 10.00% |
| Mid-Tier Creator | 10K – 100K | 6.00% | 8.00% | 7.00% |
| Macro-Creator | 100K – 1M | 5.00% | 7.00% | 6.00% |
| Mega-Influencer | 1M – 10M | 4.00% | 6.00% | 5.00% |
| Super-Influencer | 10M+ | 2.00% | 4.00% | 3.00% |
Facebook continues to be a challenging environment for organic reach. As shown in the table, there is a significant “drop-off” as the page scales.
| Audience Category | Follower Count | Emerging Benchmark (Low) | Top-Tier Benchmark (High) | Target Average |
| Nano-Page | 0 – 10K | 1.50% | 3.00% | 2.25% |
| Micro-Page | 10K – 50K | 0.80% | 1.80% | 1.30% |
| Mid-Tier Page | 50K – 200K | 0.50% | 1.20% | 0.85% |
| Macro-Page | 200K – 1M | 0.20% | 0.80% | 0.50% |
| Mega-Scale Page | 1M+ | 0.05% | 0.30% | 0.17% |
X (Twitter)
The engagement landscape on X is unique because it is heavily driven by “Impressions” and “Reposts.” Unlike Instagram or TikTok, where content is consumed more linearly, X thrives on the viral ripple effect.
| Audience Category | Follower Count | Emerging Benchmark (Low) | Top-Tier Benchmark (High) | Target Average |
| Nano-Account | 0 – 10K | 1.00% | 3.00% | 2.00% |
| Micro-Account | 10K – 50K | 0.50% | 1.50% | 1.00% |
| Mid-Tier Account | 50K – 200K | 0.20% | 0.80% | 0.50% |
| Macro-Account | 200K – 1M | 0.10% | 0.40% | 0.25% |
| Mega-Scale Account | 1M+ | 0.02% | 0.20% | 0.11% |
Engagement Benchmarks by Niche
Not all industries are created equal. A “boring” but necessary industry (like insurance) will never have the same ER as a high-passion industry (like fitness).
| Industry | TikTok | X (Twitter) | ||
| Education | 1.40% | 7.36% | 0.33% | 0.20% |
| Food & Drink | 1.15% | 6.80% | 0.18% | 0.06% |
| Animals & Pets | 2.00% | 6.50% | 0.28% | 0.16% |
| Arts & Culture | 1.82% | 5.80% | 0.18% | 0.12% |
| Sports | 1.10% | 5.60% | 0.22% | 0.14% |
| Health & Fitness | 1.20% | 5.50% | 0.15% | 0.08% |
| Design & Architecture | 1.69% | 5.20% | 0.15% | 0.08% |
| Travel | 1.35% | 5.00% | 0.10% | 0.06% |
| Entertainment | 0.75% | 4.90% | 0.12% | 0.10% |
| Technology | 0.90% | 4.80% | 0.08% | 0.08% |
| Beauty & Skincare | 0.87% | 4.50% | 0.10% | 0.04% |
| Finance & Business | 0.85% | 4.20% | 0.12% | 0.12% |
| Fashion | 0.68% | 3.80% | 0.08% | 0.04% |
| General / Others | 0.98% | 4.90% | 0.09% | 0.08% |
Why Your Engagement Could Be Low
If your numbers are dipping, consider these common culprits:
- Shadow-following: You have a high number of “bot” followers or inactive accounts from a previous era of your brand.
- Platform Fatigue: You are posting Instagram content on LinkedIn without adjusting the tone.
- Low “Shareability”: Your content is “nice” but doesn’t give users a reason to send it to a friend or save it for later.
- Inconsistency: The algorithm stops prioritizing your content if you disappear for weeks at a time.
How to Improve Your Engagement Rate
- The 2-Second Hook: In 2026, the average attention span for video is even shorter. To stay competitive, posting Reels regularly is key, and an AI reel maker makes it easy to produce high-quality Reels at scale, without the time investment of traditional video editing.
- Use Carousels for “Saves”: On Instagram and LinkedIn, carousels (slides) are the best way to get saves. Educational content that people want to refer back to is gold.
- Community Management: If you don’t reply to comments within the first hour, you are killing the conversation.
- Relatable Vulnerability: Perfection is out. “Behind the scenes” and raw, unedited takes often see 2x higher engagement than polished ads.
How to Use ER in Social Media Strategy
Don’t just track ER; use it to pivot. And here are some ways in which you can do it:
- Quarterly Audit: Identify your top 5 posts by ER. What do they have in common? (Topic, color, length, time of day?)
- Cross-Platform Comparison: If your ER is 8% on TikTok but 0.5% on Facebook, your audience is telling you where they want to see you. Shift your resources accordingly.
- Identify High-Quality, Engaging Posts: Use ER to act as a “survival of the fittest” filter for your ideas. If your data shows that “How-to” carousels consistently net a good ER, your future calendar should prioritize the educational format.
- Understand customer sentiment: Use high-engagement periods to perform qualitative “vibe checks,” treating your comment section as a free, real-time focus group for product feedback or future content gaps.
- Identify Loyal customers: ER allows you to look past the total sum and identify the “Super-Engagers” who interact with every post. These individuals are your primary candidates for brand ambassador programs and UGC.
- Identify trends: Sudden shifts in ER across your industry are early warning signals for algorithm updates or cultural pivots. If your static images suddenly drop in ER while “Raw Video” snippets climb, the platform is shifting its weight—early adoption of these shifts grants you an advantage.
- Engagement Intent: Categorize your success by the type of interaction: Saves signify educational value, Shares signify relatability, and Comments signify community.
- Find when your audience is active: Universal “best times to post” are a myth, but your specific audience has “High-Intent Windows” where they are more likely to interact than just scroll.
- Make ads with your highest-performing content: When choosing content to repurpose as social media ads, always pick the one that has the highest engagement rate.
Conclusion
Engagement rate is the only metric that keeps you honest. Whether you are a solo creator or a global brand, your goal in 2026 is to move away from “broadcasting” and toward “connection.” Benchmarks are a guide, but your own historical data is your best teacher.
FAQs
In 2026, Reach is the superior metric for internal strategy, as it measures performance against people who actually saw the post. Use Followers for external reporting or when comparing yourself to competitors.
This is a natural phenomenon called “Audience Dilution.” As your follower count increases, your content is shown to a broader, less “die-hard” audience.