


Explora este contenido con IA:
Ad creative drives 49% of the extra sales that advertising produces. That figure comes from NCSolutions’ 2023 analysis of nearly 450 sales-effect studies. Creative beats brand, reach, targeting and recency by a wide margin.
So the ad itself is the biggest lever you have. The trouble is that Meta Ads Manager can’t tell you why one ad worked. It shows which ad spent the most and what each sale cost.
Was it the opening line that did the work, or the product shot, or the offer? You’re left guessing.
Creative analytics tools exist to close that gap. Picking one is harder than it should be, though, because nearly every list ranking them was written by a vendor that put itself first.
What creative analytics tools actually do
Think of Ads Manager as the scoreboard. Creative analytics tools are the replay.
You’ll also see them called ad creative analysis tools or creative intelligence platforms. Same job, different label.
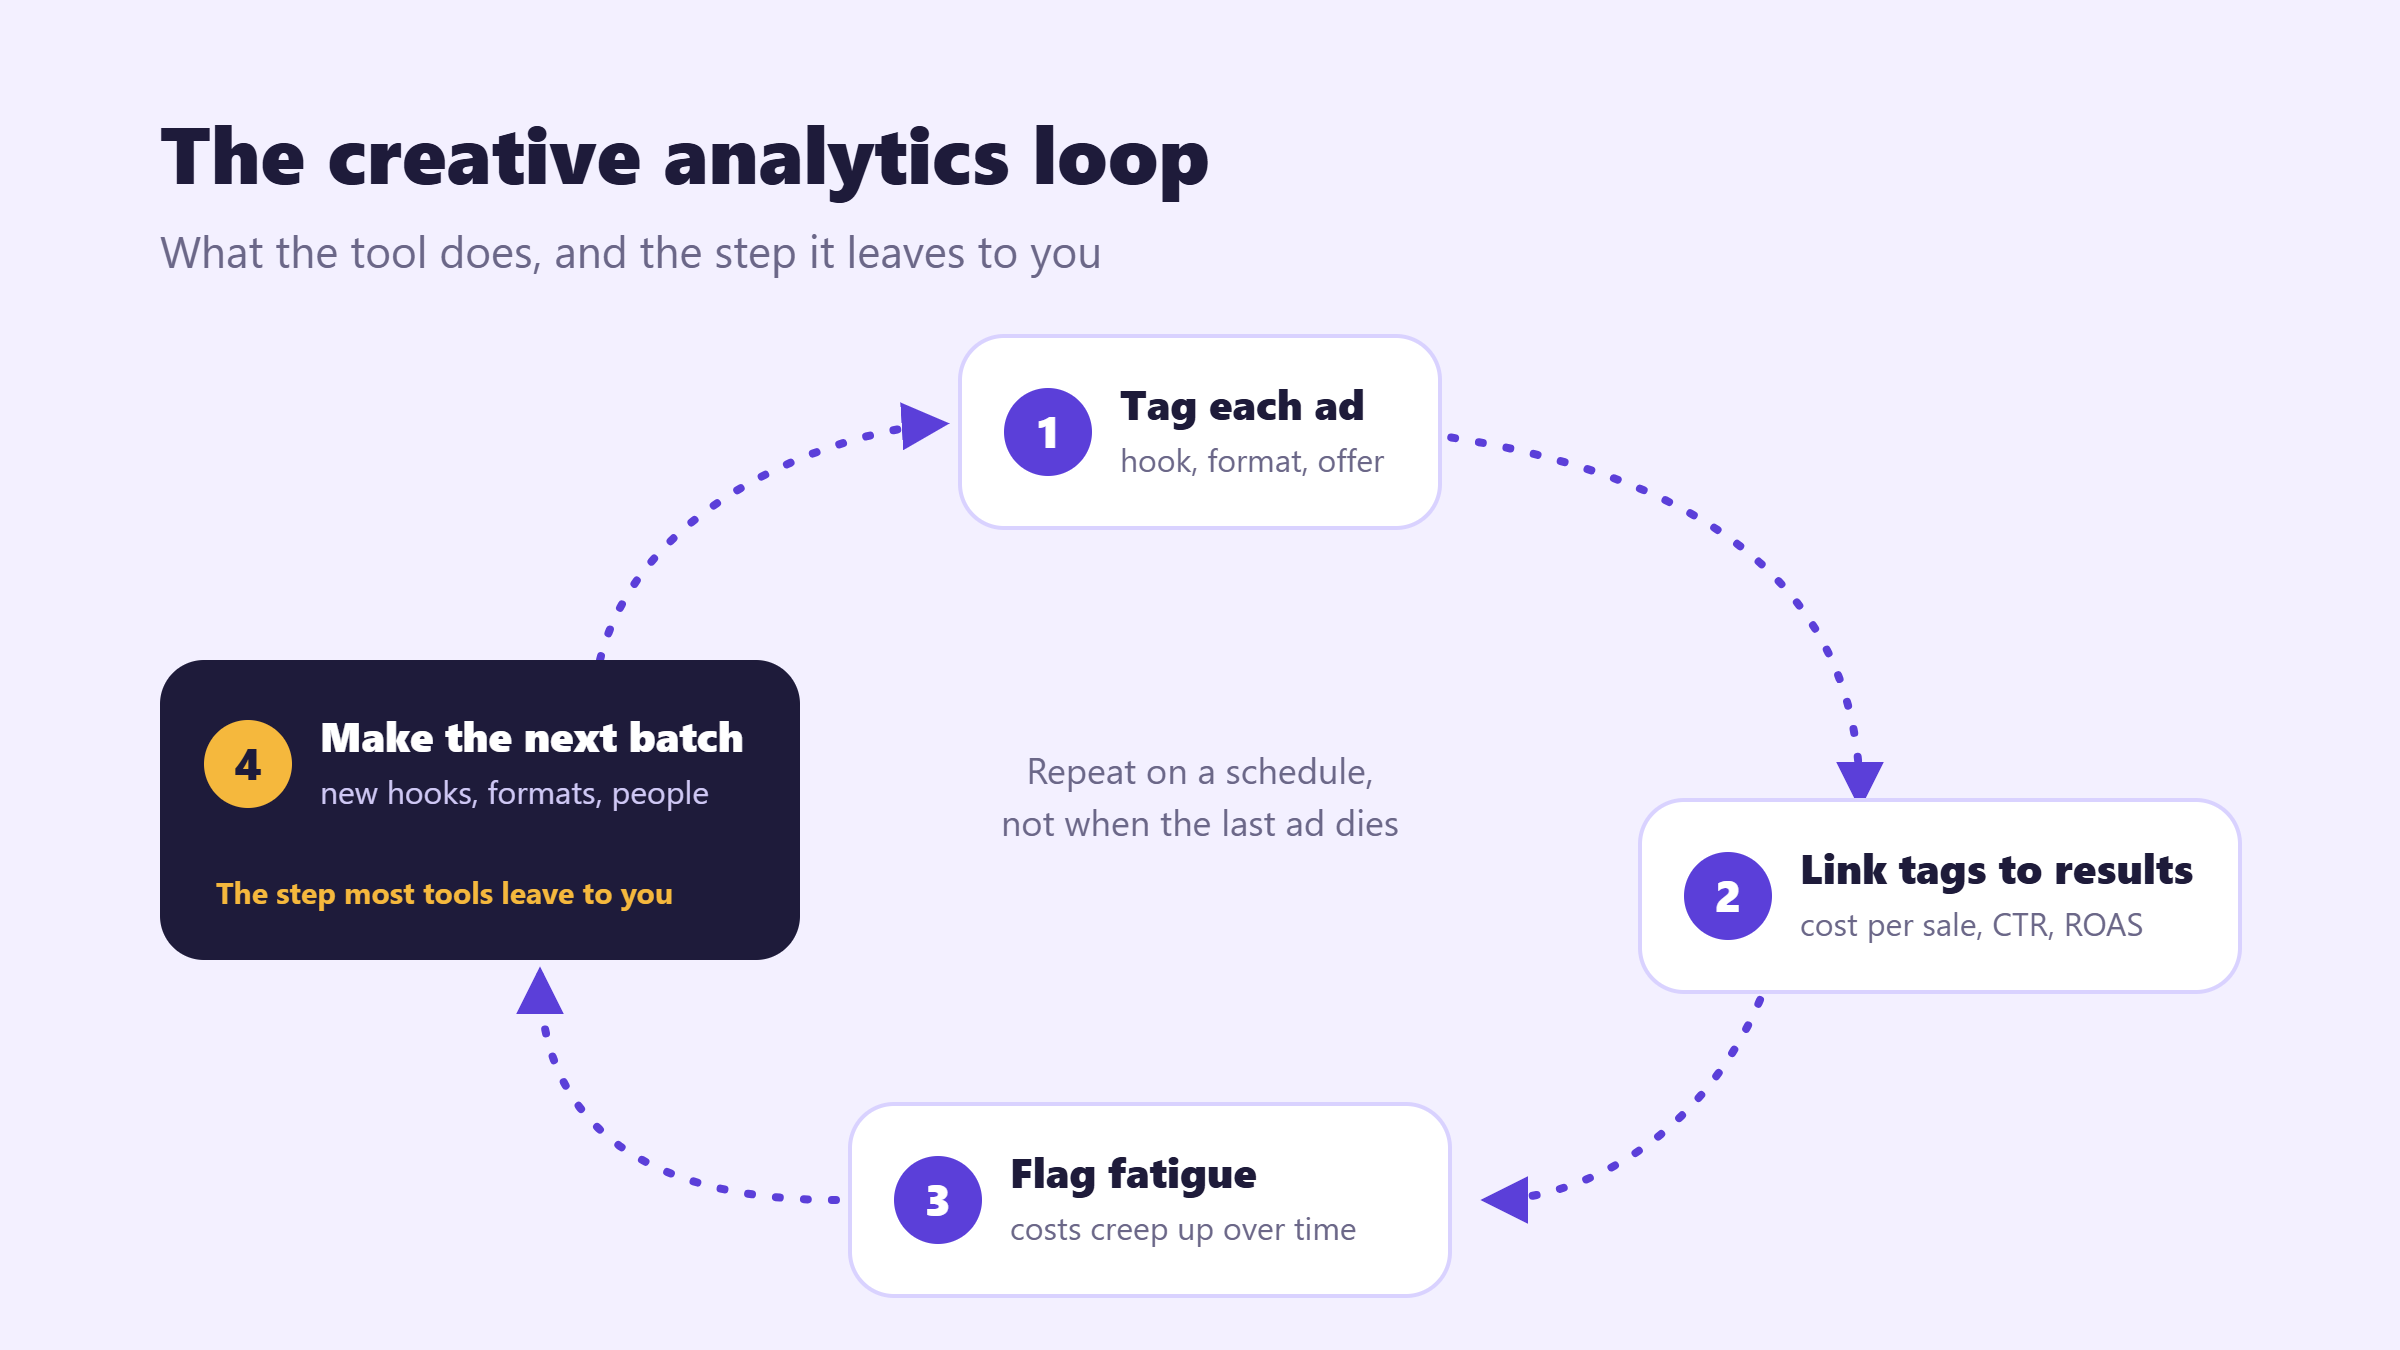
A creative analytics tool connects to your ad accounts, pulls results ad by ad, and then looks inside each ad. It labels what’s there: the opening line, the format, whether a person is on camera, the offer, the call to action.
Most now handle that labeling with AI tagging, so nobody renames 300 ads by hand. Then it groups your results by those labels.
Instead of a long list of ads and costs, you get a finding like “ads that open with a customer quote cost less per sale than ads that open with the product.”
That’s creative performance analytics in a sentence. Good creative analytics software does three jobs:
- Tags what’s inside each ad, either from your naming conventions or by reading the visuals and copy directly.
- Connects those tags to results like cost per purchase, click-through rate and return on ad spend (ROAS).
- Flags creative fatigue, the point where an ad that worked starts costing more because the same people have seen it too often.
Here’s the part vendor lists tend to skip. Meta, TikTok and Google already do a basic version of the first two jobs for free. A paid tool earns its fee once you run enough ads, on enough platforms, that the free views turn into a weekly spreadsheet chore.
Why ad creative analytics matters more in 2026
Most marketers still underrate creative. In a February 2025 Advertiser Perceptions survey, they guessed its share of sales at about 21%. That’s less than half the measured number.
Meanwhile, Meta’s ad system has put even more weight on the ad itself. In December 2024, Meta’s engineers described Andrómeda. It’s a rebuilt first step in ad delivery.
For each person, it picks a shortlist of a few thousand ads out of tens of millions. At launch, Meta reported a 6% gain in recall and an 8% gain in ad quality on selected segments.
In October 2026, Meta said Andromeda has lifted conversions on Facebook by 2.4% desde 2025.
So what changes for you? In December 2025, Meta told advertisers to treat creative variety as a basic best practice. That means different formats, messages and personas, not small tweaks of one ad. When the system picks the audience, your ads do the targeting.
That makes one question urgent. Which of your concepts are actually carrying the account?
The 8 creative analytics tools, grouped by the job you need done
These creative analytics tools aren’t ranked. A platform that suits a Shopify skincare brand is the wrong pick for a mobile game studio, so the list is grouped by job instead. Prices in this category change often (more on that below), so each entry lists how the tool charges rather than a number that may be stale by the time you read it.

1. Your ad platforms’ own reports (free)
Qué hace: Meta Ads Manager lets you filter results by ad and break them down by placement, age and platform. Google Ads informes de activos rates headlines, images and videos in Performance Max and responsive search ads as Best, Good or Low, compared with other assets of the same type. TikTok Creative Center lets you browse top ads by region and industry.
Ideal para: Accounts running a handful of ads on one or two platforms.
Pendiente de: Each view covers one network, and none of them tags what’s inside your ads. That part happens in your spreadsheet.
Modelo de precios: Free.
2. Movimiento
Qué hace: Motion is a creative reporting tool that sorts results by ad rather than by campaign. Its AI tags hooks, formats and angles, and its reports show the ads themselves next to the numbers. Motion’s página de precios also lists AI tasks and an ad leaderboard, and its Inspo library covers competitor research. Coverage spans Meta, TikTok, YouTube and LinkedIn.
Ideal para: Single brands and in-house teams on Meta and TikTok who present creative results to others every week.
Pendiente de: Motion reports and recommends, and making the next ads stays with your team. Its entry price also sits well above most tools on this list.
Modelo de precios: Tiered by monthly ad spend analyzed, with unlimited seats and ad accounts.
3. Superanuncios
Qué hace: Superads puts Meta, TikTok, LinkedIn and Google Ads results into one report, across multiple ad accounts. AI tagging labels hook type, format and visual style without relying on naming conventions. Each ad also gets a 0 to 100 score on hook, hold, click, engagement and conversion, measured against your own history rather than a global average. Reports can be shared as live links.
Ideal para: Agencies with several clients, and B2B teams that run LinkedIn or Google next to paid social.
Pendiente de: As of its July 2026 write-up, integrations with third-party attribution tools such as GA4 were on the roadmap, not live. The 14-day trial asks for a card.
Modelo de precios: Monthly plan that scales with ad spend.
4. juegos previos
Qué hace: Foreplay started as a swipe-file tool for saving ads you like. Its Spyder feature tracks competitor brands and logs new ads as they launch. Lens adds analytics for your own Meta and TikTok accounts, with segmented reports and benchmarks.
Ideal para: Creative strategists and agencies who write briefs from competitor research.
Pendiente de: Lens comes with the higher plans only. The entry plan is research without analytics.
Modelo de precios: Tiered monthly plans by seats and brands tracked.
5. Aurícula
Qué hace: Atria pairs a large library of Meta and TikTok ads with analytics on your own accounts. Its Radar engine grades your creatives and points to what’s worth scaling, and the platform includes tools for writing scripts and making new ads.
Ideal para: Meta and TikTok teams that want competitor research and creative analysis in one place.
Pendiente de: Atria’s help center lists Meta and TikTok as supported, with Google Ads and YouTube “coming soon.” It also says the product suits marketers who actively optimize, not people looking for set-and-forget.
Modelo de precios: Monthly plans with AI credits. Check current trial terms on its site.
6. Ballena triple
Qué hace: Triple Whale is an e-commerce analytics platform whose creative view sits next to attribution and Shopify order data. You judge creatives by store revenue instead of platform-reported conversions alone.
Ideal para: Shopify brands that already make decisions on blended return on ad spend.
Pendiente de: Creative analysis is one module inside a wider analytics suite, not the main event. The platform is built around Shopify.
Modelo de precios: Tiered by store revenue.
7. Magia x
Qué hace: Madgicx is built for Meta advertisers. It clusters similar ads by visual content, shows how each cluster performs, and pairs those insights with automation rules that move budget away from weak ads once you approve them.
Ideal para: Meta-first e-commerce brands that want creative insights tied to budget moves.
Pendiente de: Creative analysis comes second to the audience and budget tools. Depth outside Meta is thinner, too.
Modelo de precios: Monthly plans, with some pricing shown only inside the app.
8. Segwise
Qué hace: Segwise is built for mobile apps and games that buy ads across many networks. It covers 15+ networks, including Unity, AppLovin and Mintegral, connects to mobile measurement partners for install and retention data, and tags video frames, audio, on-screen text and even playable ads.
Ideal para: App and game teams spending across several ad networks.
Pendiente de: Segwise is made for user-acquisition managers and assumes technical comfort, and it aims at higher-volume accounts.
Modelo de precios: Scales with creative volume and networks. Larger tiers are quoted after a demo.
Creative analytics tools at a glance
Here’s the short version. “Investigación de la competencia” means the tool lets you look at other brands’ ads, not just your own.
| Plataforma | Ideal para | Plataformas publicitarias cubiertas | Investigación de la competencia | Cómo se cobra |
|---|---|---|---|---|
| Native reports | Cuentas pequeñas | One network per view | Meta Ad Library, TikTok Creative Center | Free |
| Motion | In-house teams, weekly reviews | Meta, TikTok, YouTube, LinkedIn | Yes (Inspo) | By ad spend |
| Superanuncios | Agencies, multi-platform | Meta, TikTok, LinkedIn, Google | Own accounts focus | By ad spend |
| Foreplay | Research-led briefs | Meta, TikTok (Lens) | Yes (Spyder) | By seats and brands |
| aurículas | Meta and TikTok teams | Meta, TikTok | Sí: | Plans with credits |
| ballena triple | Marcas de Shopify | Ad channels + Shopify data | No es el objetivo. | By store revenue |
| madgicx | Meta-first e-commerce | meta primero | No es el objetivo. | Planes mensuales |
| Segwise | Aplicaciones y juegos | 15+ networks incl. mobile | Solo meta | By volume, quoted |
How to read results without crowning a false winner
Creative analytics tools are good at telling you an ad “won.” Before you pour budget into it, check what “won” means.
Winners are rare. Motion’s 2026 Creative Benchmarks looked at 578,750 creatives across 6,015 Meta ad accounts and found roughly 5% qualified as winners.
About half of all creatives, in every spend tier, were switched off before 28 days. If most of your ads flop, you’re in good company. It doesn’t mean your team can’t make ads.
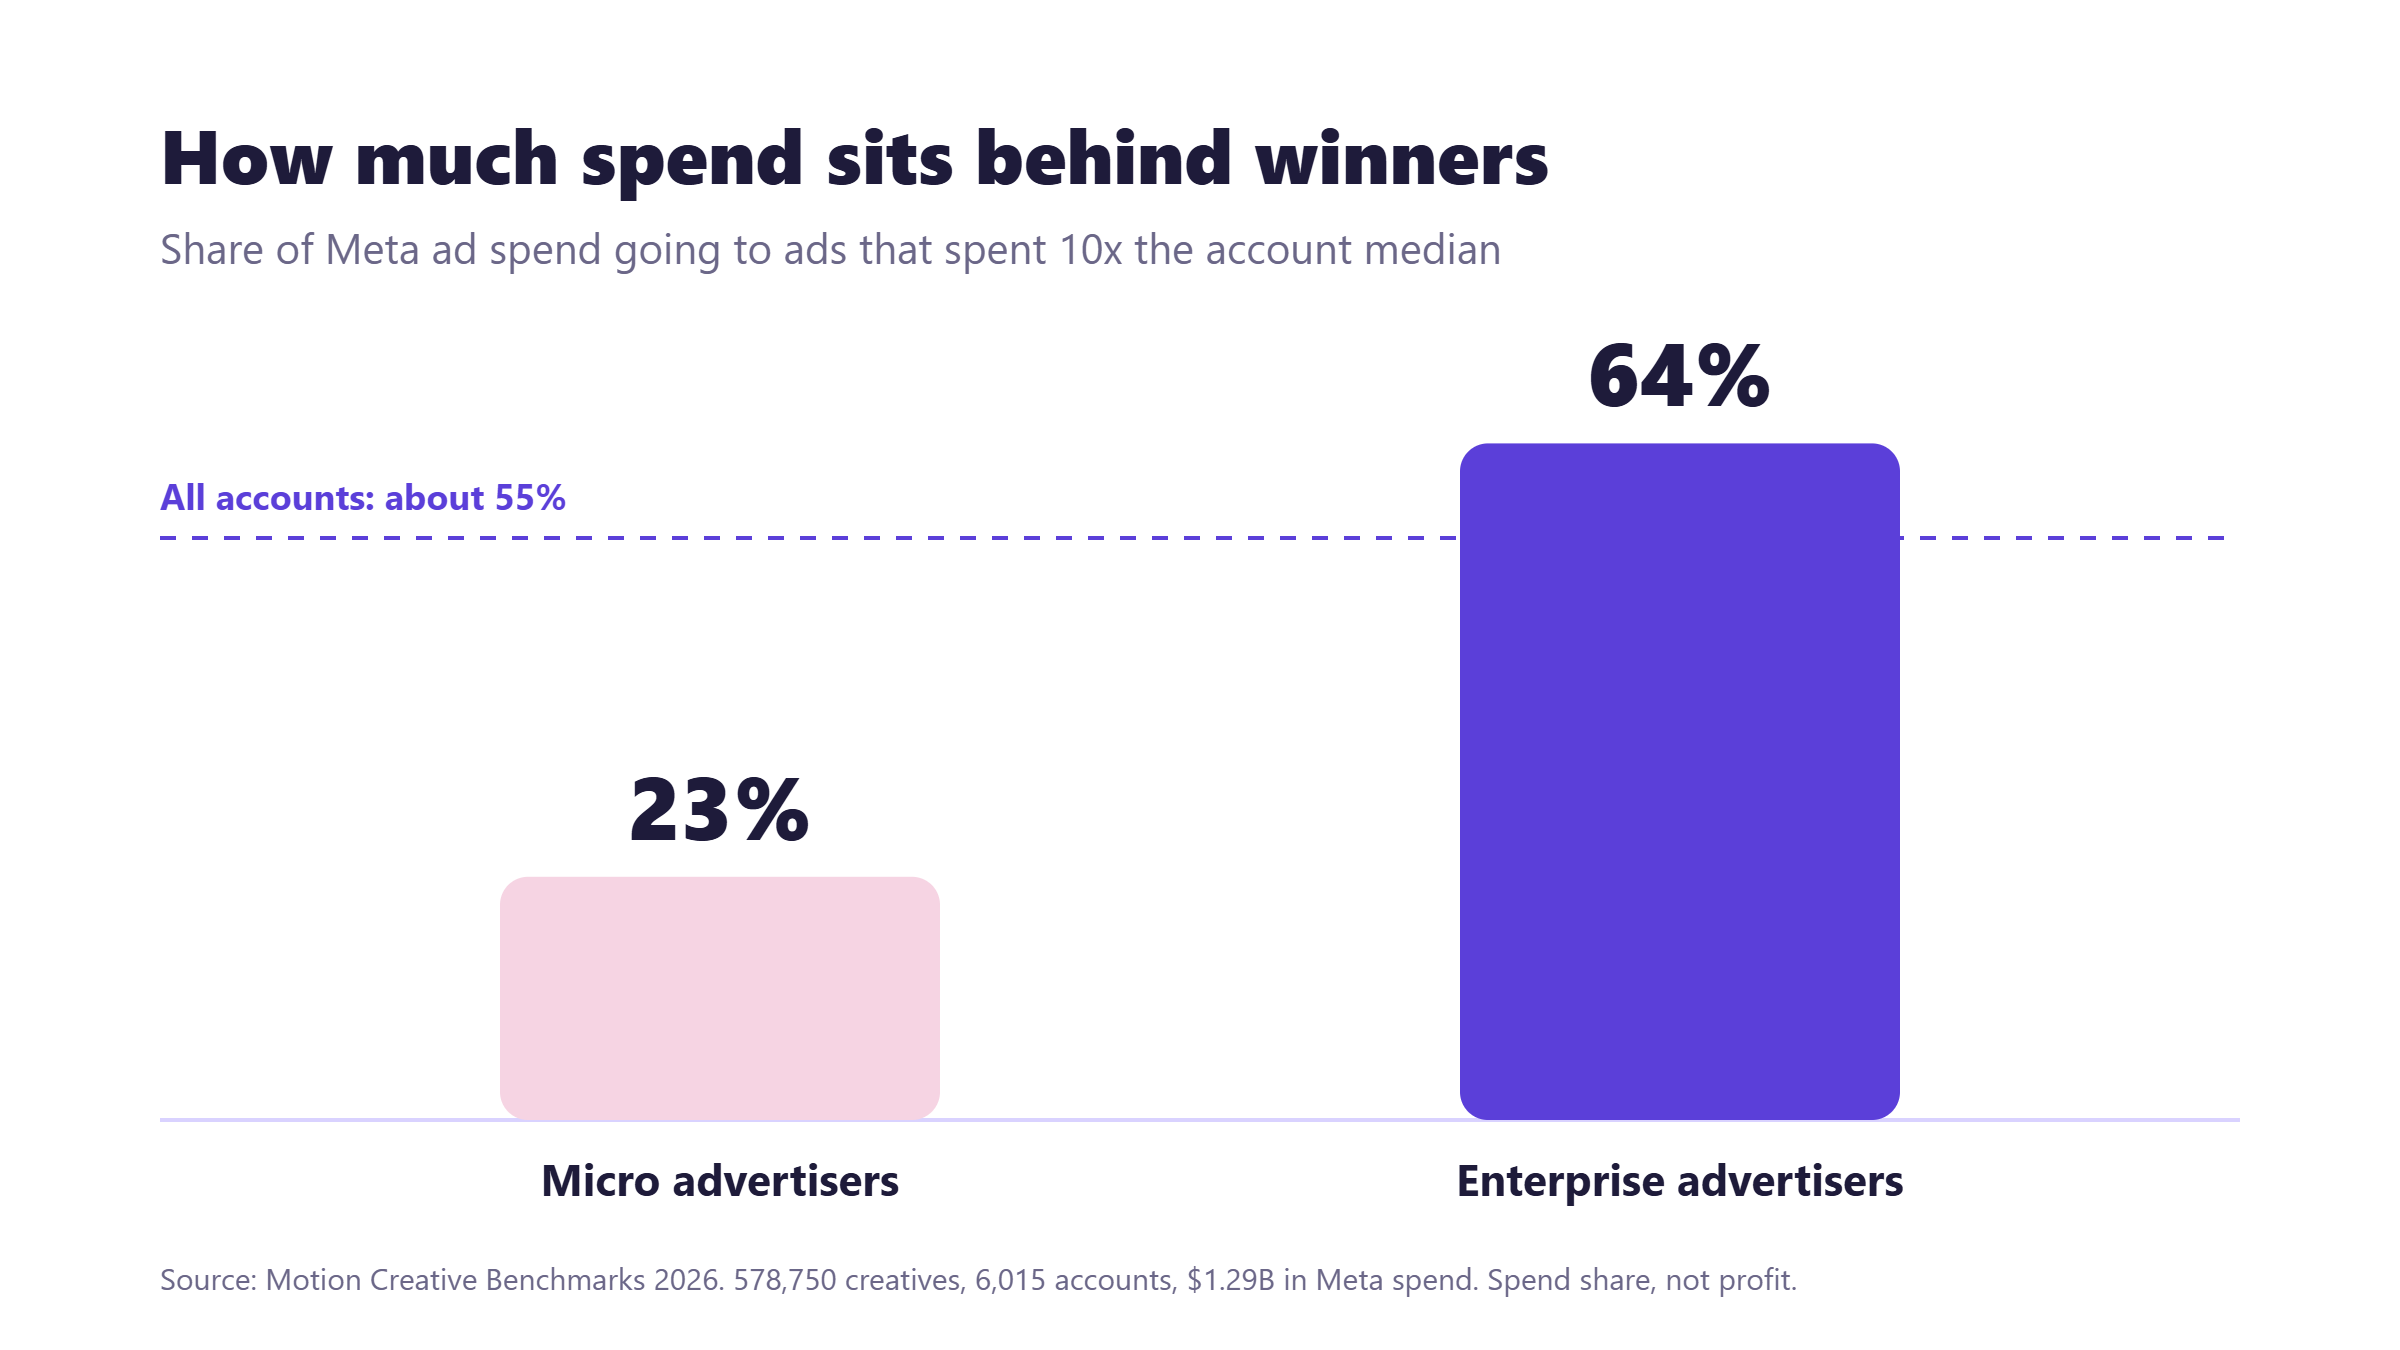
“Won” often means “spent.” In the same dataset, about 55% of spend went to the ads Motion classed as winners, meaning ads that spent at least 10 times the account’s median.
Spend tells you Meta liked delivering an ad. It doesn’t tell you the ad made money, and Motion’s own página de metodología says so: a winner by spend can still lose money. Check cost per purchase or ROAS next to spend. Every time.
Small accounts concentrate less. Micro advertisers in the study put 23% of spend behind winners, against 64% for enterprise accounts. With fewer ads in rotation, you find fewer winners and can’t cut losers as fast. That’s an argument for steady testing, not for a pricier tool.
Know your metrics before you trust a dashboard. These ad creative performance metrics show up in nearly every tool:
- Hook rate: the share of impressions that turned into a 3-second video play. It tells you whether the opening made people stop. (On TikTok, tools usually use 2-second views, so don’t compare the two directly.)
- Tasa de retención: how many of those viewers kept watching past the opening. Tools set the cutoff differently, so check how yours defines it.
- Porcentaje de clics (CTR): the share of people who clicked.
- Costo por adquisición (CPA): what one sale or lead cost you. For most businesses that sell, this is the number that pays the bills.
Compare each ad against your own account’s usual results, not a figure from someone else’s blog. A good hook rate for an impulse-buy candle won’t match one for a high-ticket coaching program. The same rule holds if you’re working out how to do ad creative analysis in a spreadsheet with no tool at all.
Want to check one of your own ads? Plug its numbers into the calculator below.
Hook and hold rate calculator
Pull these numbers for one ad from your ads manager. Nothing you type leaves this page.
Tasa de gancho
–
Tasa de retención
–
Category context helps, too. Predis.ai, Análisis de la competencia en las redes sociales shows what competitors post and how it performs, so you judge your winner against your category instead of in a vacuum.
Found your winner? Here’s what to do next
Creative analytics tools stop at the diagnosis. The money is in what you make next.
Make variants that are actually different. Under Andromeda, swapping a background color or one word in a headline gives Meta very little new to work with.
Keep what the analysis says is working, then change the structure around it: a new opening line, a different format, a different person on camera, a different reason to buy.
If a customer-quote video is your winner, try that quote as a static image, as a carousel, and as a UGC-style clip from a different kind of customer. For a step-by-step version, see this guide to ad variations for A/B testing.

Ship on a schedule. Every winner fades. Creative fatigue shows up as cost per result creeping up while frequency climbs, and these are the signs to watch on Instagram. If you only start on the next ad when the current one dies, you get a stretch where nothing works.
This is where small teams get stuck, because the analysis is quick and production isn’t. Predis.ai is built for this step. Use your proven ad as a reference and make on-brand variants with the creador de anuncios de facebook, or turn the same idea into a anuncio de vídeo UGC. If one frame is off, fix that frame without remaking the whole ad. Which variants go live is your call.
How to pick a creative analytics tool for your spend
Start with two questions: how much do you spend a month, and how many platforms or clients do you run?
- A few thousand a month on one or two platforms: empezar con el free reports and a simple sheet that logs each ad’s hook, format and offer. Improvado’s guide puts the line for a dedicated tool at around $10,000 a month in ad spend.
- One brand, mostly Meta and TikTok, weekly reviews: Motion, Atria or Foreplay.
- Several platforms or several clients: Superads.
- A Shopify store that thinks in revenue: Triple Whale.
- Meta only, and you want budget moves tied to insights: Madgicx.
- An app or game across many networks: Segwise.
Still unsure? The quick picker below asks four questions and suggests a starting point.
Which creative analytics tool fits you?
A quick word on prices (and one shutdown)
You'll see very different prices for the same creative analytics tool across "best of" lists, and that isn't always sloppy research. PricingSaaS captures of Motion's pricing page show its Starter tier at $750 a month on October 12, 2026 and $999 a month a week later. Two lists written a month apart can both be right on the day they were checked.
Products disappear, too. MagicBrief, which still appears on some lists, closed on July 31, 2026 after its team moved to Canva. Its FAQ points out that campaign data stayed in users' ad platforms.
That's worth remembering: a creative analytics platform reads your data, it doesn't own it, so switching is easier than it looks.
Check the vendor's pricing page on the day you buy. Then ask what the price is tied to: ad spend, seats, brands or credits. That decides your bill as you grow.
Conclusión
Creative analytics tools answer one question well: which of your ads earned their budget, and what those ads have in common. Pick the one that fits your spend and platforms, and read what it tells you with healthy suspicion.
Then put the finding to work. Creative's share of sales only pays off if you keep making new ads from what the data shows. Predis.ai helps you make that next batch, on brand and shaped by what works in your category, so the winner you found this month isn't your last one. Make your first ad with Predis.ai.
Preguntas Frecuentes
Creative analytics links what's inside your ads (the hook, format, offer, visuals and copy) to results like cost per purchase and return on ad spend. Standard ad reports show which ads performed. Creative analytics looks for the patterns that explain why, so your next ads start from evidence instead of a hunch.
Usually not. At that level, the free breakdowns in Meta Ads Manager, TikTok Creative Center and Google Ads asset reports cover most of what you need, especially paired with a sheet where you tag each ad by hook, format and offer. A paid tool starts earning its fee once you run dozens of ads across several platforms or clients.
No single number is worth trusting. Hook rate swings with product, price, audience and placement. Track it against your own account's typical result and look for ads that beat your baseline. A tool's benchmark feature can add context, but your own history is the fairest comparison.
No, but they work together. An A/B test checks one specific idea, like two different openings, under controlled conditions. Creative analytics scans all your ads for patterns worth testing. Use analytics to decide what to test, then confirm it with a split test in Ads Manager or one of the dedicated creative testing tools.
Some can. Foreplay, Atria and Motion include competitor ad libraries or tracking, while Superads and Triple Whale focus on your own accounts. Meta Ad Library is free for browsing any advertiser's live ads, though it shows the ads themselves, not how well they performed.
También te puede interesar: